Tiefstand
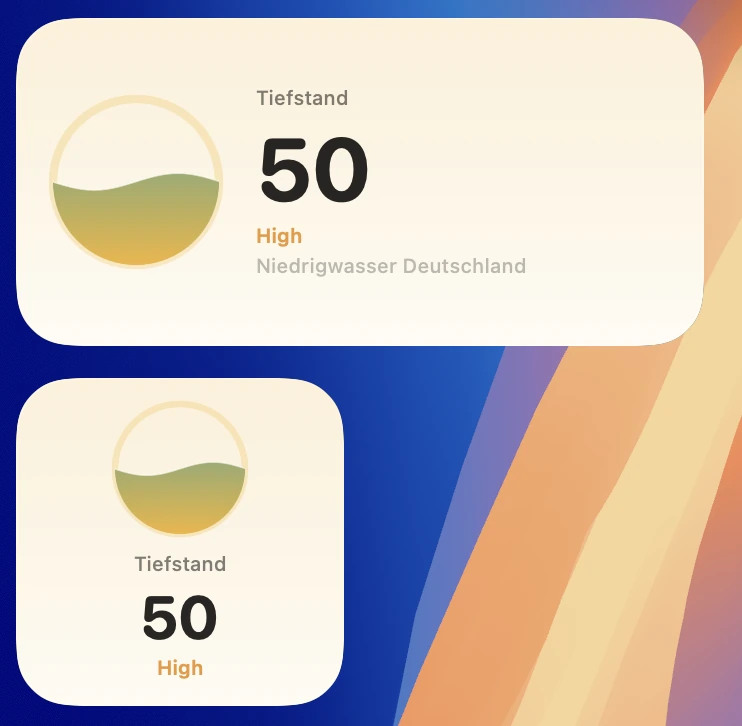
A native macOS app that lives in the menu bar and reduces Germany's low-water situation to one colour-coded number. The source is NIWIS, the nationwide low-water information system run by the Federal Institute of Hydrology, which went live in July 2026. Plus a WidgetKit widget for the desktop.
The interesting decision is the index
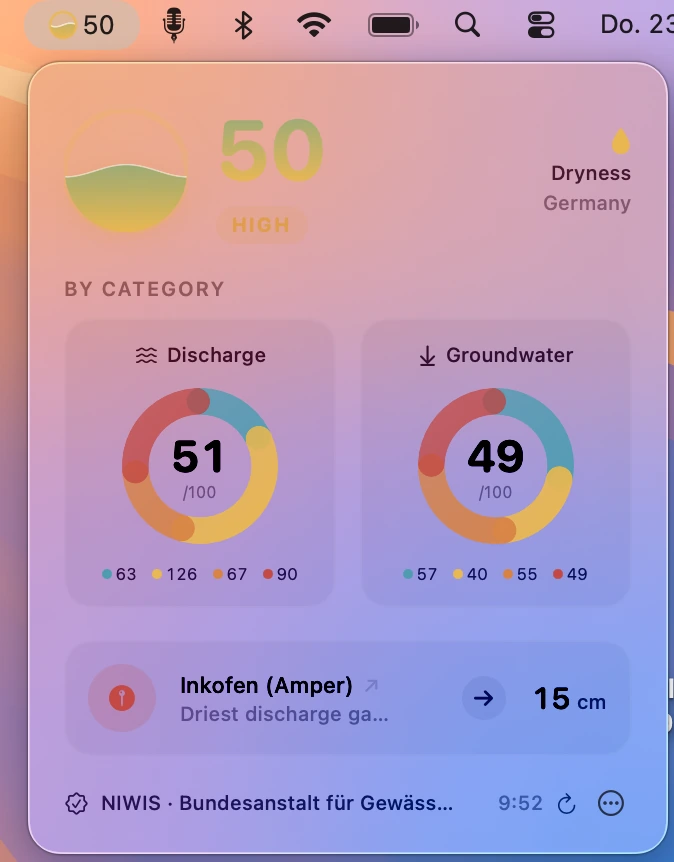
NIWIS classifies each station into four levels. Turning that into a single number means making two assumptions, and both are arguable – so both are written down in the repo.
First: the index uses discharge and groundwater only, weighted 50/50. Those are two independent hydrological compartments, above and below the surface. Water level is deliberately excluded because it would double-count surface water. Spring flow appears in the dashboard but stays out of the headline number – the network is too sparse and too regional.
Second: the four classes are treated as equally spaced. NIWIS classifies stations by percentile thresholds against the 1991–2020 WMO reference period, but does not publish the exact class boundaries. Equal spacing is therefore a minimum assumption – and I prefer that to inventing severity weights the source cannot justify.
A mean compresses the distribution; that is unavoidable. Which is why the donuts in the popover show the full spread behind the single number.
Behaving decently towards a public agency
The app reads only, polls at most every two hours, and sends an identifying User-Agent so the agency can attribute the traffic and get in touch. Nothing is mirrored or redistributed – it fetches the current national aggregate plus your own gauge, and nothing else.
Behind a DataProvider protocol sits PEGELONLINE, run by the German waterways administration, as a fallback. NIWIS is open for reuse but has no public OpenAPI spec yet – if the shape changes, the fallback takes over.
Status
Runs as a real menu bar app on live data, release v0.1.1, Swift, test-driven. Notarisation is still missing – that depends on an Apple Developer account, not on the code. Next: nearest gauge via CoreLocation, and the map of Germany.